pinecon testerThe Pine Editor is moving from the bottom panel to the side panel. This change will happen in phases over the following weeks.
By default, the new editor view overlays on the right side of the screen. For wider screens, a split-view mode is available, which automatically adjusts the chart’s width to keep it visible alongside the editor. With this new vertical orientation, users can easily edit code and view other tabs such as the Strategy Tester or Replay Trading at the same time.
Cerca negli script per "STRATEGY TESTER"

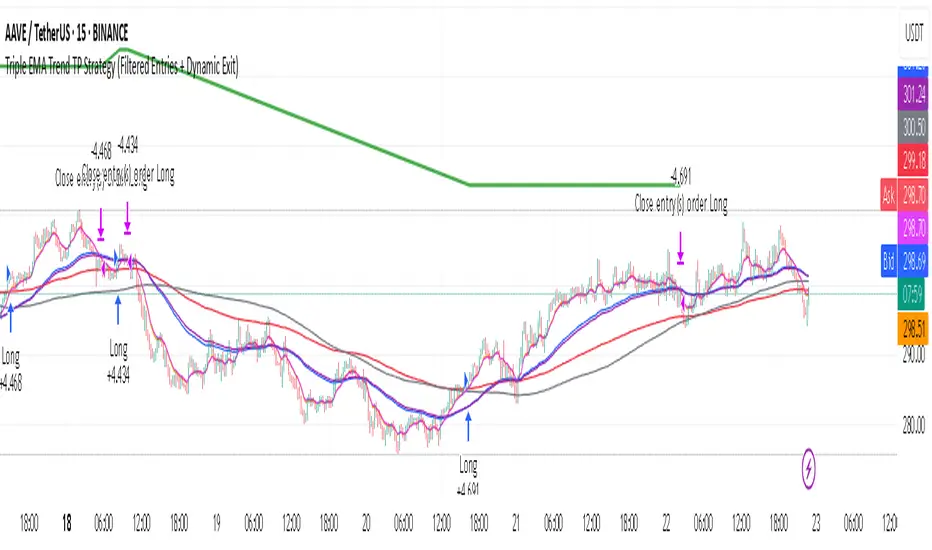
Triple EMA Trend TP Strategy (Filtered Entries + Dynamic Exit)Overview
The Triple EMA Trend TP Strategy is a robust trend-following approach designed for clear, disciplined entries and exits. It leverages a triple EMA crossover for entry signals, combined with a long‑term SMA trend filter, a fixed take‑profit percentage, and a dynamic dual‑EMA exit mechanism to optimize performance and risk management.
Key Features
Triple EMA Crossover Entry
Detects momentum shifts by waiting for the fast EMA to cross above the slow EMA, signaling bullish momentum buildup.
Trend Filter (SMA)
Ensures trades are only taken when price is above the long-term trend (SMA), filtering out low-probability setups.
Take Profit (TP)
Applies a customizable fixed TP, e.g., defaulting to 9.8%, allowing disciplined profit-taking.
Dual EMA Exit
Uses two EMAs on a separate exit logic—if the short exit EMA undercuts the mid exit EMA, the strategy closes the position.
Adjustable Parameters
All key lengths—including fast, mid, slow entry EMAs, trend SMA, exit EMAs, and TP percentage—are user-configurable to suit different assets and timeframes.
Date Range Control
Users can define a backtest window with start and end dates, preventing misleading performance outside intended periods.
Flexible Position Management
Supports full‑equity position sizing, pyramiding up to 10 entries, and runs every tick for high precision.
Setup & Inputs
fastLen: Entry Fast EMA
midLen: Entry Mid EMA
slowLen: Entry Slow EMA
trendLen: Trend Filter SMA
tpPercent: Take Profit Percentage
exitFastLen: Exit Fast EMA
exitMidLen: Exit Mid EMA
startDate / endDate: Backtest time range
Why This Strategy Stands Out
This strategy marries classic trend-following principles with modern risk-control tactics, making it both intuitive and advanced. It balances aggressive entry signals with safety checks via trend validation and layered exit logic. The inclusion of a TP ensures profits are locked in, while the dual EMA exit adds adaptive flexibility to close positions when momentum fades.
How to Use & Customize
Configure Inputs
Adjust EMAs, trend length, and TP percentage to fit your asset and timeframe. For example, shorter EMAs suit intraday trading; longer ones work well for swing strategies.
Set Backtest Range
Use the start/end date fields to limit your testing to the most relevant data, reducing noise from irrelevant market periods.
Backtest & Optimize
Review the Strategy Tester’s performance metrics—Equity curve, drawdown, profit factor, trade list—to assess effectiveness.
Fine‑Tune
Tweak TP, EMAs, or trend length to optimize drawdowns, win rate, or return profile.
PowerTrend Pro Strategy – Gold OptimizedTired of false signals on Gold?
PowerTrend Pro combines VWAP, Supertrend, RSI, and smart MA filters with trailing stops & break-even logic to deliver high-probability trades on XAUUSD.
PowerTrend Pro Strategy is a professional-grade trading system designed to capture high-probability swing and intraday opportunities on XAUUSD (Gold) and other volatile markets.
🔑 Core Features
VWAP Anchoring – institutional fair value reference to filter trades.
Supertrend (ATR-based) – adaptive trend filter tuned for Gold’s volatility.
Multi-Timeframe RSI – confirms momentum alignment across intraday and higher timeframe.
EMA + SMA Combo – ensures trades follow strong directional bias, reducing false signals.
Dynamic Risk Management
Adjustable Take Profit / Stop Loss (%)
Trailing Stop that locks in profits on extended moves
Break-Even Logic (stop loss moves to entry once price is in profit)
⚡ Gold-Tuned Presets
XAUUSD 1H → tighter TP/SL & faster entries for active intraday trading.
XAUUSD 4H → wider ATR filter & trailing stops to capture bigger swings.
Generic Mode → works on Forex, Indices, and Crypto (fully customizable).
🎯 Why It Works
Gold is notoriously volatile — quick spikes wipe out weak strategies. PowerTrend Pro solves this by combining:
✅ Institutional bias (VWAP)
✅ Adaptive trend filter (Supertrend)
✅ Momentum confirmation (RSI MTF)
✅ Robust trend structure (EMA + SMA)
✅ Smart exits (TP, SL, trailing & breakeven)
This multi-layer confirmation makes entries stronger and keeps risk under control.
🛠️ Usage
Add the strategy to your chart.
Choose a preset (XAUUSD 1H, 4H, or Generic).
Run Strategy Tester for performance metrics.
Optimize TP/SL and ATR values for your broker & market conditions.
🔥 Pro Tip: Combine this strategy with a session filter (London/NY overlap) or volume confirmation to boost accuracy in Gold.

Engulfing & Pin Bar Breakout StrategyOverview
This strategy automates a classic, powerful trading methodology based on identifying key candlestick reversal patterns and trading the subsequent price breakout. It is designed to be a complete, "set-and-go" system with built-in risk and position size management.
The core logic operates on the 1-Hour timeframe, scanning for four distinct high-probability reversal signals: two bullish and two bearish. An entry is only triggered when the market confirms the signal by breaking a key price level, aiming to capture momentum following a potential shift in market sentiment.
The Strategy Logic
The system is composed of two distinct modules: Bullish (Long) and Bearish (Short).
🐂 Bullish (Long) Setup
The script initiates a long trade based on the following strict criteria:
Signal: Identifies either a Hammer or a Bullish Engulfing pattern. These patterns often indicate that sellers are losing control and buyers are stepping in.
Confirmation: Waits for the very next candle after the signal.
Entry Trigger: A long position is automatically opened as soon as the price breaks above the high of the signal candle.
Stop Loss: Immediately set just below the low of the signal candle.
Take Profit: A fixed target is placed at a 1:5 Risk/Reward Ratio.
🐻 Bearish (Short) Setup
The script initiates a short trade based on the following strict criteria:
Signal: Identifies either a Shooting Star or a Bearish Engulfing pattern. These patterns suggest buying pressure is fading and sellers are taking over.
Confirmation: Waits for the very next candle after the signal.
Entry Trigger: A short position is automatically opened as soon as the price breaks below the low of the signal candle.
Stop Loss: Immediately set just above the high of the signal candle.
Take Profit: A fixed target is placed at a 1:4 Risk/Reward Ratio.
Key Feature: Automated Risk Management
This strategy is designed for disciplined trading. You do not need to calculate position sizes manually.
Fixed Risk: The script automatically calculates the correct position size to risk exactly 2% of your total account equity on every single trade.
Dynamic Sizing: The position size will adjust based on the distance between your entry price and your stop loss for each specific setup, ensuring a consistent risk profile.
How To Use
Apply the script to your chosen chart (e.g., BTC/USD).
Crucially, set your chart's timeframe to 1-Hour (H1). The strategy is specifically calibrated for this interval.
Navigate to the "Strategy Tester" tab below your chart to view backtest results, including net profit, win rate, and individual trades.
Disclaimer: This script is provided for educational and informational purposes only. It is not financial advice. All trading involves substantial risk, and past performance is not indicative of future results. Please use this tool responsibly and at your own risk.

Trading Report Generator from CSVMany people use the Trading Panel. Unfortunately, it doesn't have a Performance Report. However, TradingView has strategies, and they have a Performance Report :-D
What if we combine the first and second? It's easy!
This script is a special strategy that parses transactions in csv format from Paper Trading (and it will also work for other brokers) and “plays” them. As a result, we get a Performance Report for a specific instrument based on our real trades in Paper or another broker.
How to use it :
First, we need to get a CSV file with transactions. To do this, go to the Trading Panel and connect the desired broker. Select the History tab, then the Filled sub-tab, and configure the columns there, leaving only: Side, Qty, Fill Price, Closing Time. After that, open the Export data dialog, select History, and click Export. Open the downloaded CSV file in a regular text editor (Notepad or similar). It will contain a text like this:
Symbol,Side,Qty,Fill Price,Closing Time
FX:EURUSD,Buy,1000,1.0938700000000001,2023-04-05 14:29:23
COINBASE:ETHUSD,Sell,1,1332.05,2023-01-11 17:41:33
CME_MINI:ESH2023,Sell,1,3961.75,2023-01-11 17:30:40
CME_MINI:ESH2023,Buy,1,3956.75,2023-01-11 17:08:53
Next select all the text (Ctrl+A) and copy it to the clipboard.
Now apply the "Trading Report Generator from CSV" strategy to the chart with the desired symbol and TF, open the settings/input dialog, paste the contents of the clipboard into the single text input field of the strategy, and click Ok.
That's it.
In the Strategy Tester, we see a detailed Performance Report based on our real transactions.
P.S. The CSV file may contain transactions for different instruments, for example, you may have transactions for CRYPTO:BTCUSD and NASDAQ:AAPL. To view the report is based on CRYPTO:BTCUSD trades, simply change the symbol on the chart to CRYPTO:BTCUSD. To view the report is based on NASDAQ:AAPL trades, simply change the symbol on the chart to NASDAQ:AAPL. No changes to the strategy are required.
How it works :
At the beginning of the calculation, we parse the csv once, create trade objects (Trade) and sort them in chronological order. Next, on each bar, we check whether we have trades for the time period of the next bar. If there are, we place a limit order for each trade, with limit price == Fill Price of the trade. Here, we assume that if the trade is real, its execution price will be within the bar range, and the Pine strategy engine will execute this order at the specified limit price.

Gaussian Channel StrategyGaussian Channel Strategy — User Guide
1. Concept
This strategy builds trades around the Gaussian Channel. Based on Pine Script v4 indicator originally published by Donovan Wall. With rework to v6 Pine Script and adding entry and exit functions.
The channel consists of three dynamic lines:
Line Formula Purpose
Filter (middle) N-pole Gaussian filter applied to price Market "equilibrium"
High Band Filter + (Filtered TR × mult) Dynamic upper envelope
Low Band Filter − (Filtered TR × mult) Dynamic lower envelope
A position is opened when price crosses a user-selected line in a user-selected direction.
When the smoothed True Range (Filtered TR) becomes negative, the raw bands can flip (High drops below Low).
The strategy automatically reorders them so the upper band is always above the lower band.
Visual colors still flip, but signals stay correct.
2. Entry Logic
Choose a signal line for longs and/or shorts: Filter, Upper band, or Lower band.
Choose a cross direction (Cross Up or Cross Down).
A signal remains valid for Lookback bars after the actual cross, as long as price is still on the required side of the line.
When the opposite signal appears, the current position is closed or reversed depending on Reverse on opposite.
3. Parameters
Group Setting Meaning
Source & Filter Source Price series used (close, hlc3, etc.)
Poles (N) Number of Gaussian filter poles (1-9). More poles ⇒ smoother but laggier
Sampling Period Main period length of the channel
Filtered TR Multiplier Width of the bands in fractions of smoothed True Range
Reduced Lag Mode Adds a lag-compensation term (faster but noisier)
Fast Response Mode Blends 1-pole & N-pole outputs for quicker turns
Signals Long → signal line / Short → signal line Which line generates signals
Long when price / Short when price Direction of the cross
Lookback bars for late entry Bars after the cross that still allow an entry
Trading Enable LONG/SHORT-side trades Turn each side on/off
On opposite signal: reverse True: reverse -- False: flat
Misc Start trading date Ignores signals before this timestamp (back-test focus)
4. Quick Start
Add the strategy to a chart. Default: hlc3, N = 4, Period = 144.
Select your signal lines & directions.
Example: trend trading – Long: Filter + Cross Up, Short: Filter + Cross Down.
Disable either side if you want long-only or short-only.
Tune Lookback (e.g. 3) to catch gaps and strong impulses.
Run Strategy Tester, optimise period / multiplier / stops (add strategy.exit blocks if needed).
When satisfied, connect alerts via TradingView webhooks or use the builtin broker panel.
5. Notes
Commission & slippage are not preset – adjust them in Properties → Commission & Slippage.
Works on any market and timeframe, but you should retune Sampling Period and Multiplier for each symbol.
No stop-loss / take-profit is included by default – feel free to add with strategy.exit.
Start trading date lets you back-test only recent history (e.g. last two years).
6. Disclaimer
This script is for educational purposes only and does not constitute investment advice.
Use entirely at your own risk. Back-test thoroughly and apply sound risk management before trading real capital.

Trend Vanguard StrategyHow to Use:
Trend Vanguard Strategy is a multi-feature Pine Script strategy designed to identify market pivots, draw dynamic support/resistance, and generate trade signals via ZigZag breakouts. Here’s how it works and how to use it:
ZigZag Detection & Pivot Points
The script locates significant swing highs and lows using configurable Depth, Deviation, and Backstep values.
It then connects these pivots with lines (ZigZag) to highlight directional changes and prints labels (“Buy,” “Sell,” etc.) at key turning points.
Support & Resistance Trendlines
Pivot highs and lows are used to draw dashed S/R lines in real-time.
When price crosses these lines, the script triggers a breakout signal (long or short).
EMA Overlays
Up to four EMAs (with customizable lengths and colors) can be overlaid on the chart for added trend confirmation.
Enable/disable each EMA independently via the settings.
Repaint Option
Turning on “Smooth Indicator Lines” (repaint) uses future data to refine past pivots.
This can make historical signals look cleaner but does not reflect true historical conditions.
Turning it off ensures signals remain fixed once they appear.
Strategy Entries & Exits
On each new ZigZag “Buy” or “Sell” signal, the script closes any open position and flips to the opposite side (if desired).
Works with the built-in TradingView Strategy engine for backtesting.
Additional Inputs (Placeholders)
Volume Filter and RSI Filter settings exist but are not fully implemented in the current code. Future versions may incorporate these filters more directly.
How to Use
Add to Chart: Click “Indicators” → “Invite-Only Scripts” (or “My Scripts”) and select “Trend Vanguard Strategy.”
Configure Settings:
Adjust ZigZag Depth, Deviation, and Backstep to fine-tune pivot sensitivity.
Enable or disable each EMA to see how it aligns with market trends.
Toggle “Smooth Indicator Lines” on or off depending on whether you want repainting.
Backtest and Forward Test:
Use TradingView’s “Strategy Tester” tab to review hypothetical performance.
Remember that repainting can alter past signals if enabled.
Monitor Live:
Watch for breakout triangles or ZigZag labels to identify potential reversal or breakout trades in real time.
Disclaimer: This script is purely educational and not financial advice. Always combine it with sound risk management and thorough analysis. Enjoy exploring the script, and feel free to experiment with the different settings to match your trading style!

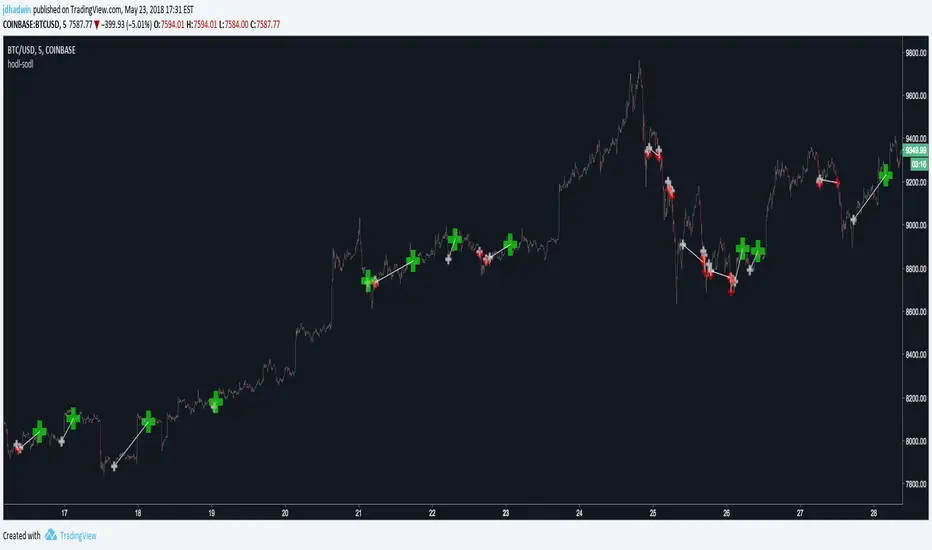
Buy & Hold aka. HODL StrategyThis is a simply HODL or Buy & Hold strategy, which is super useful to see the risk and reward of such a strategy.
The benefit of using this strategy is that you also get to see the Max Drawdown (Risk).
This way you can compare it to the Net Profit (Reward) and decide if it's worth it for you.
This strategy buys on the Start Date and sells either on the End Date or on the last candle if the End Date is in the future.
Remember that the strategy must close the trade (sell) otherwise you don't see any results in the Strategy Tester (this is how it works).

Statistics TableStrategy Statistics
This library will add a table with statistics from your strategy. With this library, you won't have to switch to your strategy tester tab to view your results and positions.
Usage:
You can choose whether to set the table by input fields by adding the below code to your strategy or replace the parameters with the ones you would like to use manually.
// Statistics table options.
statistics_table_enabled = input.string(title='Show a table with statistics', defval='YES', options= , group='STATISTICS')
statistics_table_position = input.string(title='Position', defval='RIGHT', options= , group='STATISTICS')
statistics_table_margin = input.int(title='Table Margin', defval=10, minval=0, maxval=100, step=1, group='STATISTICS')
statistics_table_transparency = input.int(title='Cell Transparency', defval=20, minval=1, maxval=100, step=1, group='STATISTICS')
statistics_table_text_color = input.color(title='Text Color', defval=color.new(color.white, 0), group='STATISTICS')
statistics_table_title_cell_color = input.color(title='Title Cell Color', defval=color.new(color.gray, 80), group='STATISTICS')
statistics_table_cell_color = input.color(title='Cell Color', defval=color.new(color.purple, 0), group='STATISTICS')
// Statistics table init.
statistics.table(strategy.initial_capital, close, statistics_table_enabled, statistics_table_position, statistics_table_margin, statistics_table_transparency, statistics_table_text_color, statistics_table_title_cell_color, statistics_table_cell_color)
Sample:
If you are interested in the strategy used for this statistics table, you can browse the strategies on my profile.

Binary Option Strategy Tester with Martingale-Basic V.2In Binary options, strategy testing is a bit different. The strategy result depends upon expiry intervals and payout ratio.
My previous script was a try to resolve this but has some bugs in specific choices. The new version overcame those and added some new features useful for binary option strategy testing.
Assumption:
We are opening position at next candle after signal come
Chart interval is option expiry time.
We are taking the position at opening price
Our call will be profitable if we get a green candle and put will be profitable if we get a red candle
We can open only one trade at a time. So if we are in trade, subsequent signals will be ignored.
All Input Options:
Test Call/Put individually or both. Default BOTH
Select up to 5 Martingale levels. Default 2
Type of Martingale Trade. Default “SAME”
“SAME”: If you are trading CALL and incur a loss, you are taking CALL in subsequent Martingale levels.
“OPSITE”: if you are trading CALL and incur a loss, you are taking PUT in subsequent Martingale levels.
“FOLLOW CANDLE COLOR”: You are following candle color in Martingale levels, i.e if the loss candle is RED, you are taking PUT in subsequent candles.
“OPPOSITE CANDLE COLOR”: You are taking opposite candle color trade, i.e if the loss candle is RED, you are taking CALL in subsequent candle.
Select Specific Trading Session. Please select “USE SPECIFIC SESSION”. Default: TRUE
Put the investment amount per option. Default: 10
Payout ratio. Default: 80%
The strategy is taken from Vdub Binary Options SniperVX v1 (by @vdubus). I have deleted extra parts and kept only the necessary parts.
Result Table
Signal and Win Levels:
Signal and Loss:
Please note that Binary options trading is very risky. You must be aware of the risk and be willing to accept them in order to invest in binary options. Only invest what you can afford to lose. The past performance of any trading system, strategy, or methodology is not necessarily indicative of future results.

Close v Open Moving Averages Strategy (Variable) [divonn1994]This is a simple moving average based strategy that works well with a few different coin pairings. It takes the moving average 'opening' price and plots it, then takes the moving average 'closing' price and plots it, and then decides to enter a 'long' position or exit it based on whether the two lines have crossed each other. The reasoning is that it 'enters' a position when the average closing price is increasing. This could indicate upwards momentum in prices in the future. It then exits the position when the average closing price is decreasing. This could indicate downwards momentum in prices in the future. This is only speculative, though, but sometimes it can be a very good indicator/strategy to predict future action.
What I've found is that there are a lot of coins that respond very well when the appropriate combination of: 1) type of moving average is chosen (EMA, SMA, RMA, WMA or VWMA) & 2) number of previous bars averaged (typically 10 - 250 bars) are chosen.
Depending on the coin.. each combination of MA and Number of Bars averaged can have completely different levels of success.
Example of Usage:
An example would be that the VWMA works well for BTCUSD (BitStamp), but it has different successfulness based on the time frame. For the 12 hour bar timeframe, with the 66 bar average with the VWMA I found the most success. The next best successful combo I've found is for the 1 Day bar timeframe with the 35 bar average with the VWMA.. They both have a moving average that records about a month, but each have a different successfulness. Below are a few pair combos I think are noticeable because of the net profit, but there are also have a lot of potential coins with different combos:
It's interesting to see the strategy tester change as you change the settings. The below pairs are just some of the most interesting examples I've found, but there might be other combos I haven't even tried on different coin pairs..
Some strategy settings:
BTCUSD (BitStamp) 12 Hr Timeframe : 66 bars, VWMA=> 10,387x net profit
BTCUSD (BitStamp) 1 Day Timeframe : 35 bars, VWMA=> 7,805x net profit
BNBUSD (Binance) 12 Hr Timeframe : 27 bars, VWMA => 15,484x net profit
ETHUSD (BitStamp) 16 Hr Timeframe : 60 bars, SMA => 5,498x net profit
XRPUSD (BitStamp) 16 Hr Timeframe : 33 bars, SMA => 10,178x net profit
I only chose these coin/combos because of their insane net profit factors. There are far more coins with lower net profits but more reliable trade histories.
Also, usually when I want to see which of these strategies might work for a coin pairing I will check between the different Moving Average types, for example the EMA or the SMA, then I also check between the moving average lengths (the number of bars calculated) to see which is most profitable over time.
Features:
-You can choose your preferred moving average: SMA, EMA, WMA, RMA & VWMA.
-You can also adjust the previous number of calculated bars for each moving average.
-I made the background color Green when you're currently in a long position and Red when not. I made it so you can see when you'd be actively in a trade or not. The Red and Green background colors can be toggled on/off in order to see other indicators more clearly overlayed in the chart, or if you prefer a cleaner look on your charts.
-I also have a plot of the Open moving average and Close moving average together. The Opening moving average is Purple, the Closing moving average is White. White on top is a sign of a potential upswing and purple on top is a sign of a potential downswing. I've made this also able to be toggled on/off.
Please, comment interesting pairs below that you've found for everyone :) thank you!
I will post more pairs with my favorite settings as well. I'll also be considering the quality of the trades.. for example: net profit, total trades, percent profitable, profit factor, trade window and max drawdown.
*if anyone can figure out how to change the date range, I woul really appreciate the help. It confuses me -_- *

EMA Cloud Intraday Strategy********NOT TRADING ADVICE - USE AT YOUR OWN RISK - TRADING IS RISKY - DO NOT BLINDLY FOLLOW THE SIGNALS FROM THIS STRATEGY********
This strategy utilizes the 9 and 20 period exponential moving averages to create a colored cloud between similar to what is seen on the Ichimoku Cloud. The strategy closes all trades by the end of the trading day. Entry is when the price closes above a Green (9 EMA above 20 EMA) cloud or below a Red (9 EMA below 20 EMA) cloud. Exit is when price closes against the 9 EMA or at the end of the trading day. Running the strategy tester on different intraday time frames will show the best time frame for a given Symbol. For example, I have found that the best results are returned by this strategy for SPY on the 30 minute time frame.
********NOT TRADING ADVICE - USE AT YOUR OWN RISK - TRADING IS RISKY - DO NOT BLINDLY FOLLOW THE SIGNALS FROM THIS STRATEGY********

TDI Hedge Strategy
This is the incomplete version but upon multiple requests, I have released it early. All of the strategy and alert functions are yet to be written and I'll get around to it soon.
This indicator aims to be the best TDI indicator on TradingView. It is a strategy or study. It will have all of the filter, entry, and exit conditions for the strategies around the TDI.
What is implemented
MFI or RSI: the MFI is a much better TDI baseline than the RSI, in my opinion, and very effective
EMA or SMA used for the moving averages on fast, slow, and volatility band
Dynamic timeframe: set a factor of current timeframe and indicator will analyse higher timeframe automatically
Manual timeframe: set a higher timeframe to analyse different to currently viewed
Features for later
conditions for TDI filters/entries/exits
Strategy functions to use built-in strategy tester
BTE signal plot for Backtesting & Trading Engine
alerts
Enjoy!

Delta-RSI Strategy (with filters)Delta-RSI Strategy (with filters):
This is a version of the Delta-RSI Oscillator strategy with several criteria available to filter entry and exit signals. This script is also suitable for backtesting over a user-defined period and offers several risk management options (take profit and stop loss).
Since the publication of the Delta-RSI Oscillator script, I have been asked many times to make it compatible with the Strategy Tester and add filtering criteria to minimize "false" signals. This version covers many of these requests. Feel free to insert your favorite D-RSI parameters and play around!
ABOUT DELTA-RSI
Delta-RSI represents a smoothed time derivative of the RSI designed as a momentum indicator (see links below):
INPUT DESCTIPTION
MODEL PARAMETERS
Polynomial Order : The order of local polynomial used to interpolate the relative strength index (RSI).
Length : The length of the lookback frame where local regression is applied.
RSI Length : The timeframe of RSI used as input.
Signal Length : The signal line is a EMA of the D-RSI time series. This input parameter defines the EMA length.
ALLOWED ENTRIES
The strategy can include long entries, short entries or both.
ENTRY AND EXIT CONDITIONS
Zero-crossing : bullish trade signal triggered when D-RSI crosses zero from negative to positive values (bearish otherwise)
Signal Line Crossing : bullish trade signal triggered when D-RSI crosses from below to above the signal line (bearish otherwise)
Direction Change : bullish trade signal triggered when D-RSI was negative and starts ascending (bearish otherwise)
APPLY FILTERS TO
The filters (described below) can be applied to long entry, short entry and exit signals.
RELATIVE VOLUME FILTER
When activated, the D-RSI-driven entries and exits will be triggered only if the current volume is greater than N times the average over the last M bars.
VOLATILITY FILTER
When activated, the D-RSI-driven entries and exits will be triggered only if the N-period average true range, ATR, is greater than the M-period ATR. If N < M, this condition implies increasing volatility.
OVERBOUGHT/OVERSOLD FILTER
When activated, the D-RSI-driven entries and exits will be triggered only if the value of 14-period RSI is in the range between N and M.
STOP LOSS/TAKE PROFIT
Fixed and trailing stop loss as well as take profit options are available.
FIXED BACKTESTING START/END DATES
If the checkboxes are not checked, the strategy will backtest all available price bars.

Configurable BB+RSI+Aroon strategy backtest for binary optionsI wanted to share this strategy that I use myself for binary options trading. After trading binary options for several years I have learned that every single day is unique... assets behave differently every single day. So, when I start the day I want to know which is the optimum combination of parameters in my indicators that will give me the signals I want during the day and I get that by doing a quick backtest of the parameters combination in a specific asset that same day. When trading Binary Options I usually do 3 or 4 trades max per day and, yes, there are moments in which even with the right backtest data the signals fail (I strongly believe that there is no strategy that guarantees 100% success in any type of trade, and this one here is not an exception - but has worked well with some assets). So, here is my contribution to improve your productivity by automating a bit that backtesting part.
How this script works?
It is a simple price crossunder / crossover Bollinger Bands (BB) with a confirmation from RSI overbought / oversold signals and a fast Aroon. You will see the BB plotted with its confirmations:
(1) a blue circle that plots in the chart when the price is coming back inside the channel (within the Bollinger Bands)
(2) an orange square that plots in the chart when the RSI is coming back from the overbought or oversold areas
(3) a triangle that could be red or green depending on the Aroon confirmation: Red if Aroon Down is crossing down Aroon Up or green if vice versa.
The strategy will call for long (Call) if:
(1) the price is crossing over the lower band of the Bollinger Bands, coming back inside the channel
(2) Aroon Up is crossing or has crossed above Aroon Down
(3) RSI is crossing over the oversold limit
Consequently, the strategy will call for a short (Put) if:
(1) the price is crossing down the upper band of the Bollinger Bands, coming back inside the channel
(2) Aroon Down is crossing or has crossed below Aroon Up
(3) RSI is crossing under the overbought limit
You can configure:
1. Aroon length (keep it as fast as possible: 3, 4 or 5 are recommended values)
2. The point where Aroon Up and Aroon Down cross to make the signal valid (50 is by default. It could also be 25 or 75)
3. The RSI length
4. RSI Overbought and Oversold limits (they do not need to be symmetric: you can use 29 and 93, for example)
5. Bollinger Bands length and standard deviation
6. Number of bars to keep your option open. Depending on the timeframe used, this will determine the time you will keep your binary option open. If you are in a 1 min chart and keep this parameter in 3, then you will need to configure your binary option to expire in 3 minutes.
How to evaluate your backtest?
In Binary Options you only need the success rate, so what I do is that when I am manually updating the parameters I keep my strategy tester window open checking the winning trades vs losing trades ratio ("Percent Profitable"). I personally will only keep an asset monitored looking for signals that day if the Percent Profitable on the backtest of the same day is above 80%.
Regarding the code: it is open, public and free. No need to ask for permission if you want to copy+paste and use it in whole or parts.
Happy pip hunting!
-marco

Refined MA + Engulfing (M5 + Confirmed Structure Break)I would like to start by saying that this strategy was put together using ChatGPT, some past trades from myself and some backtested trades, and from my time as a student in Wallstreet Academy under Cue Banks.
I am not profitable yet. I am too jumpy and blow accounts. I'm hoping this strategy (and it's indicator twin) can help me spend less time on the charts, so that I'm not tempted to press buttons as much.
It does fire quite a bit. But, the Strategy Tester tab shows a 30% win rate with our wins being significant to our losses. So, in theory, if you followed the rules of this strategy STRICTLY, you COULD BE profitable.
With that being said, there are times that this strategy has shown to trigger and I ask, "Why?".
I just want to help myself and others, and maybe make some decent\cool stuff along the way. Enjoy
KR

FVG Breakout Lite by tradingbauhausExplanation of "FVG Breakout Lite by tradingbauhaus"
This script is a trading strategy built for TradingView that helps you spot and trade "Fair Value Gaps" (FVGs)—price areas where the market moved quickly, leaving a gap that might act as support or resistance later. It’s designed to catch breakout opportunities when the price moves strongly in one direction, with extra filters to make trades more reliable. Here’s how it works and how you can use it:
What It Does
1. Finds Fair Value Gaps (FVGs):
A "Bullish FVG" happens when the price jumps up quickly, leaving a gap below where it didn’t trade much (e.g., today’s low is higher than the high from two bars ago).
A "Bearish FVG" is the opposite: the price drops fast, leaving a gap above (e.g., today’s high is lower than the low from two bars ago).
The script draws colored boxes on your chart to show these gaps: green for bullish, red for bearish.
2. Spots Breakouts:
It looks for "strong" FVGs by comparing them to a trend (based on the highest highs and lowest lows over a set period).
If a bullish gap forms above the recent highs, or a bearish gap below the recent lows, it’s marked as a breakout opportunity.
3. Adds a Volume Check:
Trades only happen if the market’s volume is higher than usual (e.g., 1.2x the average volume over the last 20 bars). This helps ensure the breakout has real momentum behind it.
4. Trades Automatically:
Long Trades (Buy): If a bullish breakout FVG forms and volume is high, it buys at the current price.
Short Trades (Sell): If a bearish breakout FVG forms with high volume, it sells short.
Each trade comes with a stop loss (to limit losses) and a take profit (to lock in gains), both adjustable by you.
5. Shows Mitigation Lines (Optional):
If you turn on "Display Mitigation Zones," it draws lines at the edge of each breakout FVG. These lines show where the price might return to "fill" the gap later, helping you see key levels.
6. Includes Webull Costs:
The script factors in real trading fees from Webull, like tiny SEC and FINRA fees for selling, and a daily margin cost if you’re borrowing money to trade. These don’t show up on the chart but affect the strategy’s performance in backtesting.
How to Use It
1. Add to Your Chart:
Copy the script into TradingView’s Pine Editor, click "Add to Chart," and it’ll start drawing FVGs and running the strategy.
2. Customize Settings:
Trend Period (Default: 25): How many bars it looks back to define the trend. Longer periods mean fewer but stronger signals.
Volume Lookback (Default: 20) & Volume Threshold (Default: 1.2): Adjust how it measures "high volume." Increase the threshold for stricter trades.
Stop Loss % (Default: 1.5%) & Take Profit % (Default: 3%): Set how much you’re willing to lose or aim to gain per trade.
Margin Rate % (Default: 8.74%): Webull’s rate for borrowing money—lower it if your account qualifies for a better rate.
Display Mitigation Zones (Default: On): Toggle this to see or hide the gap lines.
Colors: Change the green (bullish) and red (bearish) shades to suit your chart.
3. Backtest It:
Go to the "Strategy Tester" tab in TradingView to see how it performs on past data. It’ll show trades, profits, losses, and Webull fees included.
4. Watch It Work:
Green boxes mean bullish FVGs; red boxes mean bearish FVGs. If volume spikes and the price breaks out, you’ll see trades happen automatically.
What to Expect
Visuals: You’ll see colored boxes for FVGs and optional lines showing where they start. These help you spot key price zones even if you’re not trading.
Trades: It’s selective—only trades when FVGs align with a breakout and volume confirms it. Expect fewer trades but with higher potential.
Risk: The stop loss keeps losses in check, while the take profit aims for a 2:1 reward-to-risk ratio by default (3% gain vs. 1.5% loss).
Costs: Webull’s fees are small but baked into the results, so you’re seeing a realistic picture of profits.
Tips for Users
Test it on a small timeframe (like 5-minute charts) for day trading or a larger one (like daily) for swing trading.
Play with the volume threshold—if you get too few trades, lower it (e.g., 1.1); if too many, raise it (e.g., 1.5).
Watch how price reacts to the mitigation lines—they’re often support or resistance zones traders target.
This strategy is lightweight, focused, and built for traders who like breakouts with a bit of confirmation. It’s not foolproof (no strategy is!), but it gives you a clear way to trade FVGs with some smart filters.

Combo 2/20 EMA & CCI
This is another part of my research work, where I test a combination of two strategies, receiving a combined signal. In order to understand which indicator combinations work better, which work worse, as filters for trades. This is combo strategies for get a cumulative signal.
First strategy
This indicator plots 2/20 exponential moving average. For the Mov Avg X 2/20 Indicator, the EMA bar will be painted when the Alert criteria is met.
Second strategy
The Commodity Channel Index (CCI) is best used with markets that display cyclical or seasonal characteristics, and is formulated to detect the beginning and ending of the cycles by incorporating a moving average together with a divisor that reflects both possible and actual trading ranges. The final index measures the deviation from normal, which indicates major changes in market trend.
Strategy tester settings:
Initial capital: 1000
Order size: 0.5
Commission: 0.1%
Other as default.
Indicator settings:
EMA Length: 50
CCI Length: 10
Fast MA Length: 15
Slow MA Length: 20
Other as default.
WARNING:
- For purpose educate only
- This script to change bars colors.

Trailing Take Profit - Close Based📝 Description
This script demonstrates a new approach to the trailing take profit.
Trailing Take Profit is a price-following technique. When used, instead of setting a limit order for the take profit target exiting from your position at the specified price, a stop order is conditionally set when the take profit target is reached. Then, the stop price (a.k.a trailing price), is placed below the take profit target at a distance defined by the user percentagewise. On regular time intervals, the stop price gets updated by following the "Trail Barrier" price (high by default) upwards. When the current price hits the stop price you exit the trade. Check the chart for more details.
This script demonstrates how to implement the close-based Trailing Take Profit logic for long positions, but it can also be applied for short positions if the logic is "reversed".
📢 NOTE
To generate some entries and showcase the "Trailing Take Profit" technique, this script uses the crossing of two moving averages. Please keep in mind that you should not relate the Backtesting results you see in the "Strategy Tester" tab with the success of the technique itself.
This is not a complete strategy per se, and the backtest results are affected by many parameters that are outside of the scope of this publication. If you choose to use this new approach of the "Trailing Take Profit" in your logic you have to make sure that you are backtesting the whole strategy.
⚔️ Comparison
In contrast to my older "Trailing Take Profit" publication where the trailing take profit implementation was tick-based, this new approach is close-based, meaning that the update of the stop price occurs at the bar close instead of every tick.
While comparing the real-time results of the two implementations is like comparing apples to oranges, because they have different dynamic behavior, the new approach offers better consistency between the backtesting results and the real-time results.
By updating the stop price on every bar close, you do not rely on the backtester assumptions anymore (check the Reasoning section below for more info).
The new approach resembles the conditional "Trailing Exit" technique, where the condition is true when the current price crosses over the take profit target. Then, the stop order is placed at the trailing price and it gets updated on every bar close to "follow" the barrier price (high). On the other hand, the older tick-based approach had more "tight" dynamics since the trailing price gets updated on every tick leaving less room for price fluctuations by making it more probable to reach the trailing price.
🤔 Reasoning
This new close-based approach addresses several practical issues the older tick-based approach had. Those issues arise mainly from the technicalities of the TV Backtester. More specifically, due to the assumptions the Broker Emulator makes for the price action of the history bars, the backtesting results in the TV Backtester are exaggerated, and depending on the timeframe, the backtesting results look way better than they are in reality.
The effect above, and the inability to reason about the performance of a strategy separated people into two groups. Those who never use this feature, because they couldn't know for sure the actual effect it might have in their strategy, (even if it turned out to be more profitable) and those who abused this type of "repainting" behavior to show off, and hijack some boosts from the community by boasting about the "fake" results of their strategies.
Even if there are ways to evaluate the effectiveness of the tick-based approach that is applied in an existing strategy (this is out of the topic of this publication), it requires extra effort to do the analysis. Using this closed-based approach we can have more predictable results, without surprises.
⚠️ Caveats
Since this approach updates the trailing price on bar close, you must wait for at least one bar to close after the price crosses over the take profit target.

DMI StrategyThis strategy is based on DMI indicator. It helps me to identify base or top of the script. I mostly use this script to trade in Nifty bank options, even when the signal comes in nifty . It can be used to trade in other scripts as well. Pivot points can also be used to take entry. Long entry is taken when DI+(11) goes below 10 and DI-(11) goes above 40 , whereas short entry is taken when DI-(11) goes below 10 and DI+(11) goes above 40.
For bank nifty , I take the trade in the strike price for which the current premium is nearby 300, with the SL of 20%. If premium goes below 10% I buy one more lot to average, but exit if the premium goes below 20% of the first entry. If the trade moves in the correct direction, we need to start trailing our stoploss or exit at the pre-defined target.
As this a strategy, there is one problem. While we are in the phase of "long", if again the "long" phase comes, it will not be shown on chart until a "short" phase has come, and vice versa. This has been resolved by creating an indicator instead of strategy with the name of "DMI Buy-sell on chart". Please go through that to get more entry points.
Please have a look at strategy tester to back test

A simple trading strategy for XTZ/EUR (December 2021)This is my current trading strategy for XTZ/EUR for this month of December.
It tries to avoid pumps/dumps (i.e. does not trade on big candles).
It always performs one order in each candle for the trading window of the rebalance bear/bull market indicator (check my profile for it).
It has alerts configured so that you can use it in your server/broker (just pass along the `{{strategy.order.alert_message}}` in the alert message, it will include a positive number of XTZ when to buy, or a negative number when to sell).
It does not repaint.
The amount of crypto and fiat in the portfolio can be configured in the cog.
It does not outperform buy/hold for the bull months.
Check the results in the Data Window of Trading View (please avoid the Strategy Tester, it has too many bugs and is not intended for out of the box strategies such a this one).
All code is open source.

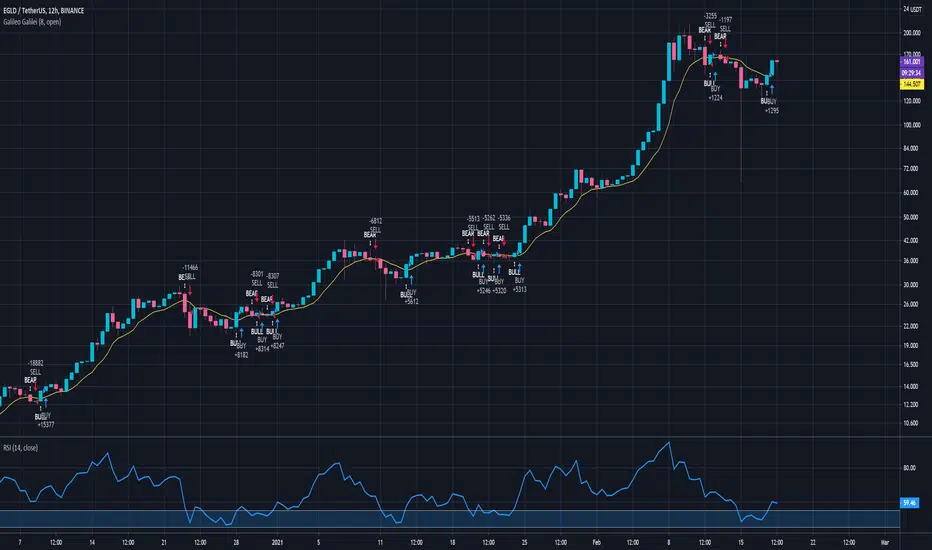
Galileo GalileiGalileo Galilei
Is the simplest of them all and easy to understand:
It has an Exponential Moving Average that you can modify to suit your pair on the chart with it's timeframe, looking at the strategy tester to compare results;
The prices for the EMA are taken from the OPEN of every candle (depending on your timeframe);
If the current candle's price closes above the Average and the new candle opens above the average, it will trigger a buying signal because of the bullish setup;
If the current candle's price closes below the Average and the new candle opens below the average, it will trigger a selling signal because of the bearish setup;
No strategy works on all charts and on all timeframes so you have to feel free to modify the parameters to suit your trading setup;
It is possible that the strategy won't give you any good results at all on some trading pairs and timeframes so be careful because it can lose money;
This strategy is called Galileo Galilei, it's free for you all to use and it was developed to be as simple as it can be and to work in bullish or bearish scenarios, but not in flat movements.
You can message me to ask questions, I respond to every message.
Green pips!
AutoView - Hodl to SodlWrite your own strategy and use Hodl to Sodl to send Alerts for when to buy & sell, and automatically plot your anticipated buys/sells to the chart. A must have for AutoView users. Requires Pine Script coding. Not compatible with "Strategy Tester" tab and "Paper Trading" tab in TradingView.
Hodl-Sodl itself is not a strategy. It is a framework for building AutoView strategies. For demonstration purposes, the image featured with this script shows an example of a very simple CCI strategy (and not a very good one), but you would presumably replace that with your own ideas. If you'd like a little help plugging in your own strategy, contact jdhadwin for custom coding.